IC Markets Home Sign in Web Trader Contact Us
IC Markets Social IC Markets Social

Information Hub for
Serious Traders

  • ABOUT US
  • OPEN LIVE ACCOUNT
  • OPEN DEMO ACCOUNT
  • TRADE NOW
  • VISIT OUR BLOG
IC Markets Social
  • ABOUT US
  • OPEN LIVE ACCOUNT
  • OPEN DEMO ACCOUNT
  • TRADE NOW
  • VISIT OUR BLOG
June 13, 2024Australian_Stocks_enIC Markets

Will Hong Kong 50 Index have enough momentum to break support?

An emerging Falling Wedge has been detected on Hong Kong 50 Index on the 4 hour chart. There is a possible move towards 17694.4094 next few candles. Once reaching resistance it may continue its bearish run or reverse back to current price levels.

Read more
June 13, 2024Australian_Stocks_enIC Markets

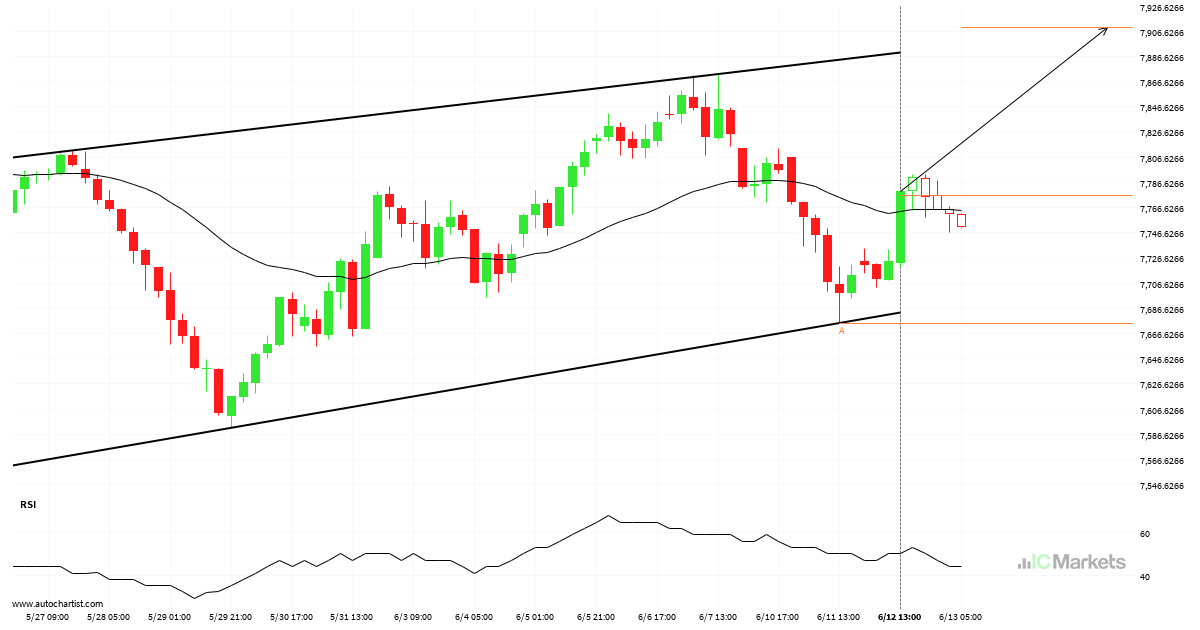
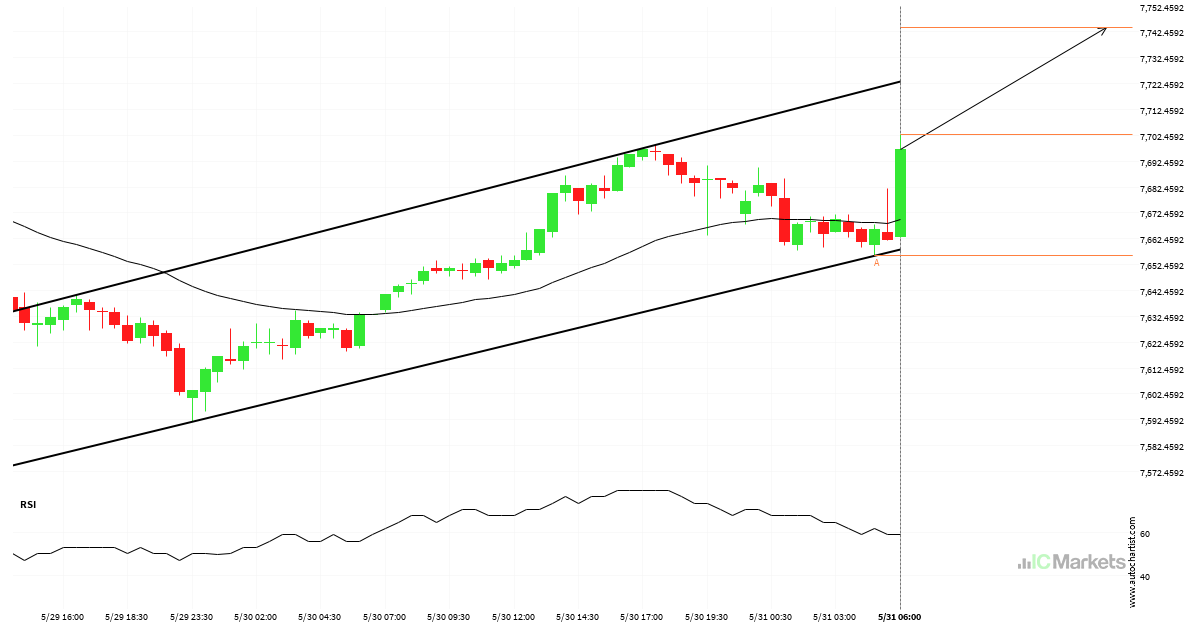
Australia 200 Index – getting close to resistance of a Channel Up

Australia 200 Index was identified at around 7776.44 having recently rebounded of the support on the 4 hour data interval. Ultimately, the price action of the stock has formed a Channel Up pattern. This squeeze may increases the chances of a strong breakout. The projected movement will potentially take the price to around the 7909.2667 […]

Read more
June 12, 2024Australian_Stocks_enIC Markets

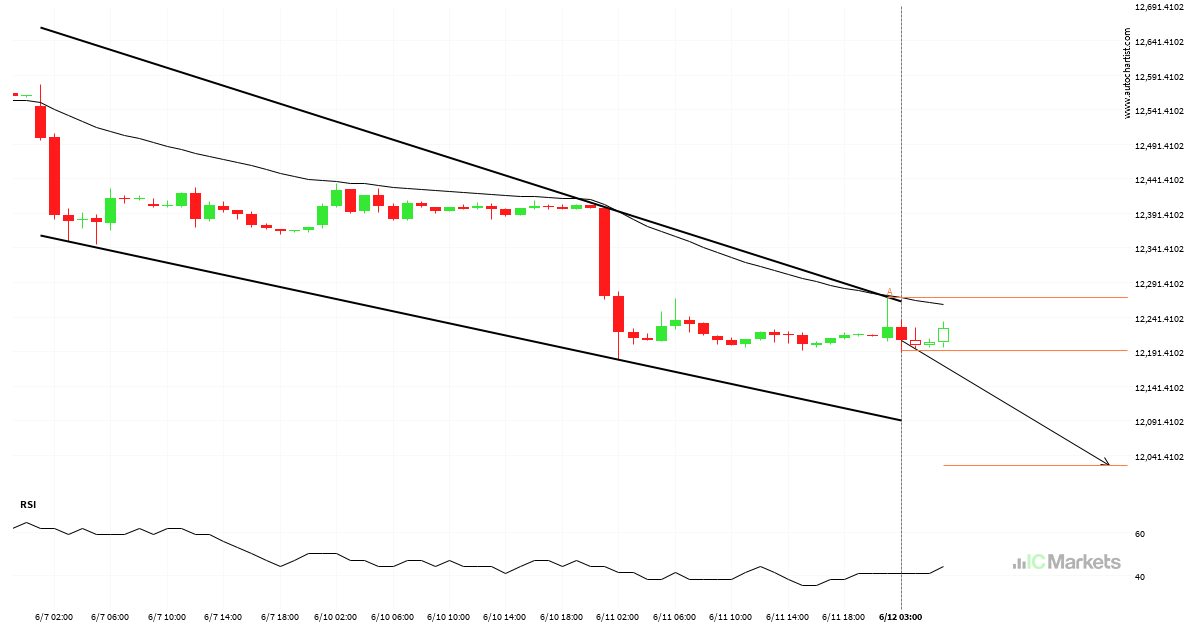
Should we expect a breakout or a rebound on FTSE China A50 Index?

FTSE China A50 Index was identified at around 12192.73 having recently rebounded of the resistance on the 1 hour data interval. Ultimately, the price action of the stock has formed a Falling Wedge pattern. This squeeze may increases the chances of a strong breakout. The projected movement will potentially take the price to around the […]

Read more
June 11, 2024Australian_Stocks_enIC Markets

Rare opportunity on FTSE China A50 Index – extreme bearish movement

FTSE China A50 Index hits 12210.88 after a 1.54% move spanning 12 hours.

Read more
June 9, 2024Australian_Stocks_enIC Markets

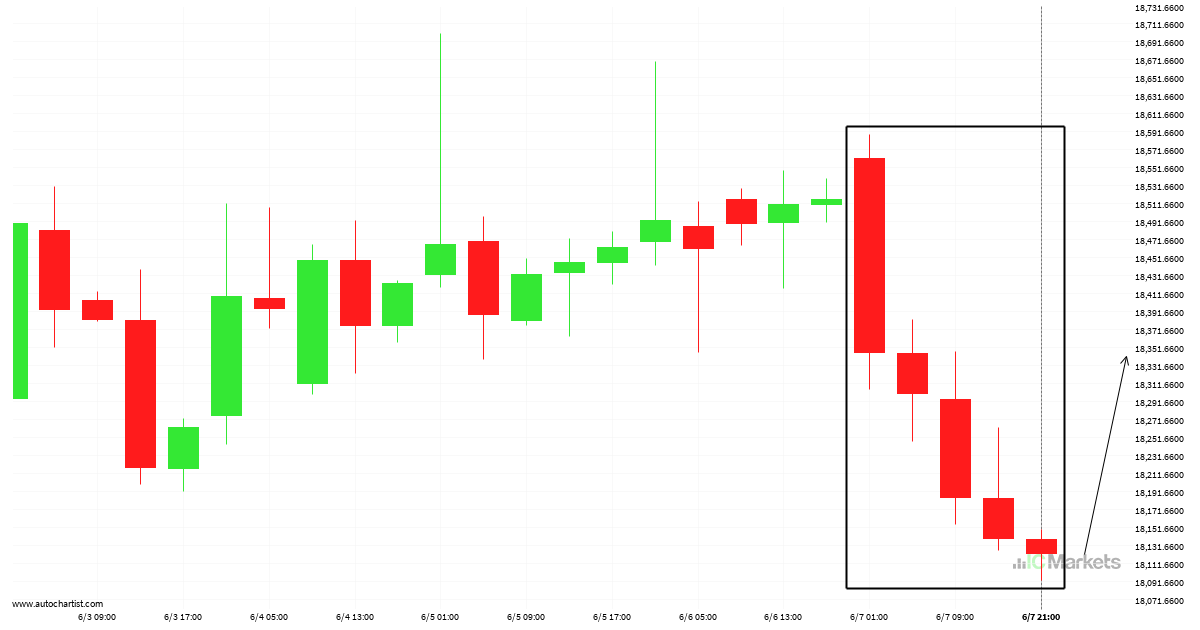
Where is Hong Kong 50 Index moving to?

Trend followers are probably eagerly watching Hong Kong 50 Index to see if its latest 5 consecutive candles continues. If not, the mean-reversion people out there will be delighted with this exceptionally large 20 hours move.

Read more
June 6, 2024Australian_Stocks_enIC Markets

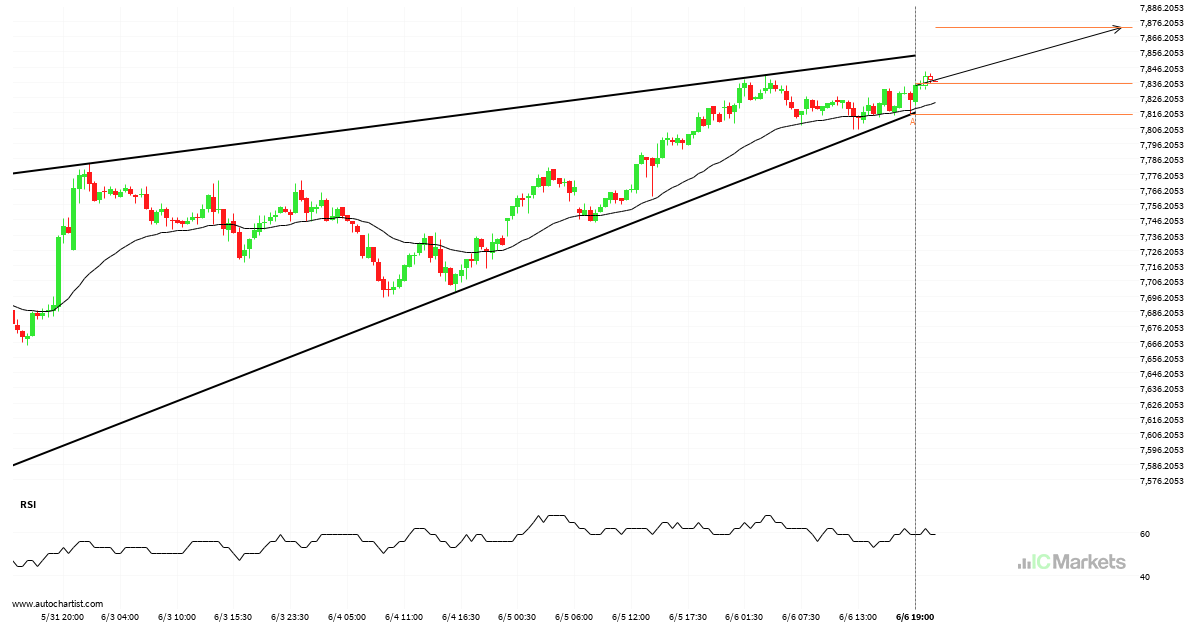
Will Australia 200 Index have enough momentum to break resistance?

A Rising Wedge pattern was identified on Australia 200 Index at 7835.23, creating an expectation that it may move to the resistance line at 7871.8902. It may break through that line and continue the bullish trend or it may reverse from that line.

Read more
June 4, 2024Australian_Stocks_enIC Markets

FTSE China A50 Index short term bullish trade setup to 12710.8799

FTSE China A50 Index is moving towards a resistance line. Because we have seen it retrace from this level in the past, we could see either a break through this line, or a rebound back to current levels. It has touched this line numerous times in the last 20 days and may test it again […]

Read more
June 3, 2024Australian_Stocks_enIC Markets

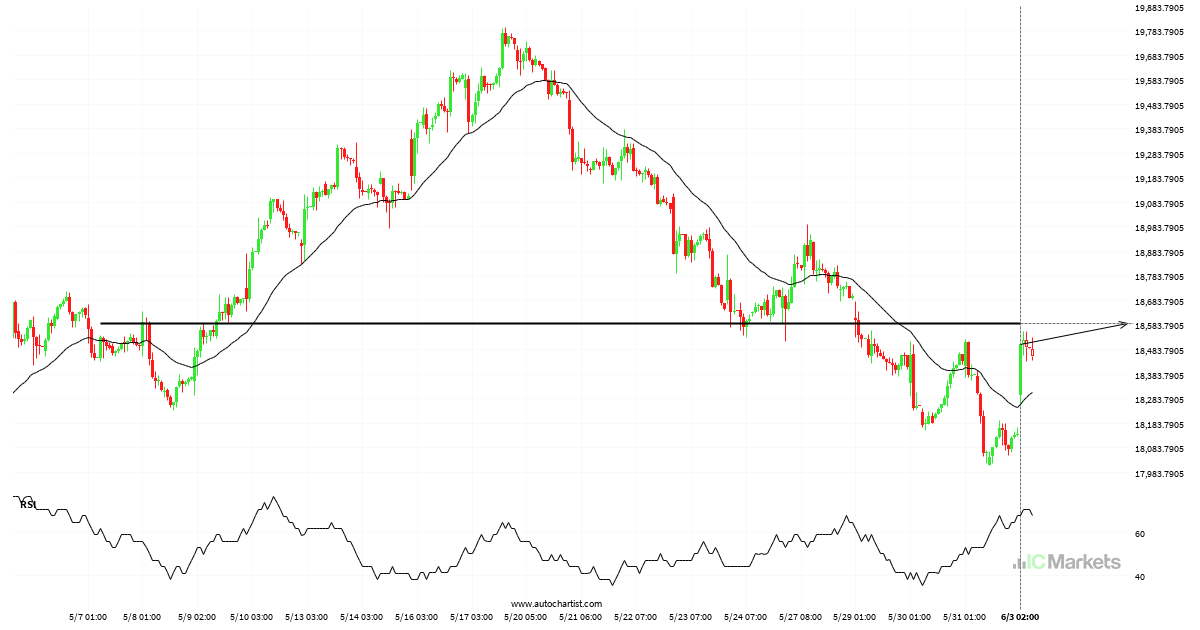
A final push possible on Hong Kong 50 Index

Hong Kong 50 Index is moving towards a line of 18589.5508 which it has tested numerous times in the past. We have seen it retrace from this position in the past, so at this stage it isn’t clear whether it will breach this price or rebound as it did before. If Hong Kong 50 Index […]

Read more
May 31, 2024Australian_Stocks_enIC Markets

Either a rebound or a breakout imminent on Australia 200 Index

Australia 200 Index is moving towards a resistance line. Because we have seen it retrace from this line before, we could see either a break through this line, or a rebound back to current levels. It has touched this line numerous times in the last 2 days and may test it again within the next […]

Read more
May 29, 2024Australian_Stocks_enIC Markets

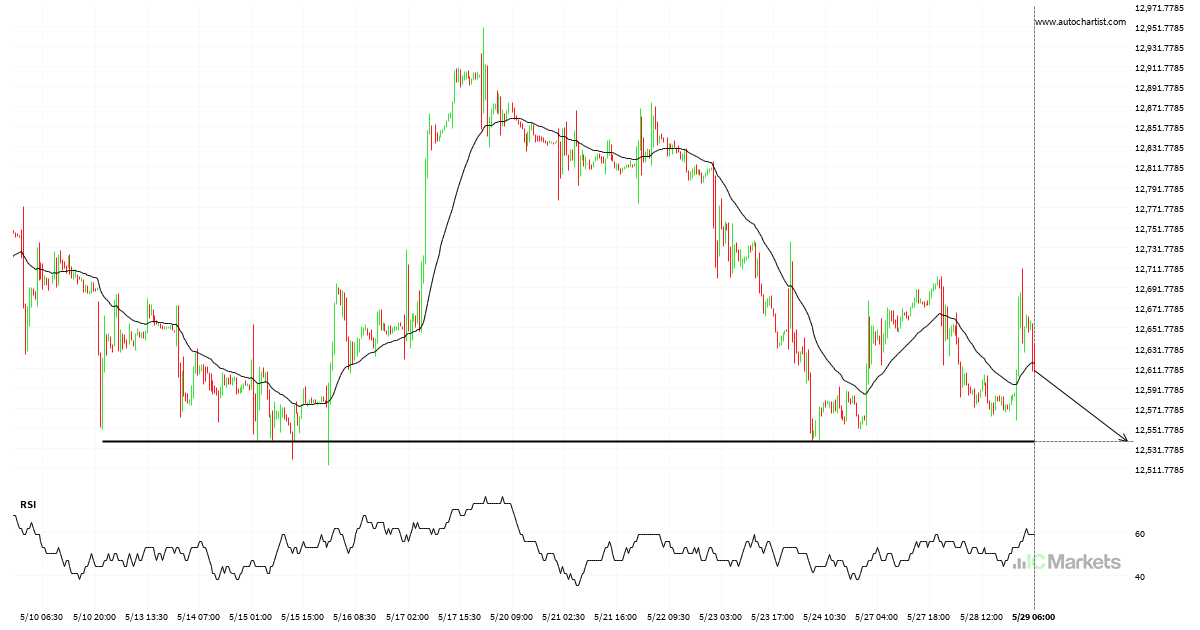
Breach of important price line imminent by FTSE China A50 Index

FTSE China A50 Index is heading towards a line of 12538.6602. If this movement continues, the price of FTSE China A50 Index could test 12538.6602 within the next 3 days. But don’t be so quick to trade, it has tested this line numerous times in the past, so this movement could be short-lived and end […]

Read more
  • 1
  • 2
  • 3
  • …
  • 9
  • 10
  • 11
  • 12
  • 13
  • 14
  • 15
  • …
  • 153
  • 154
  • 155

Recent Posts

  • US Dollar vs Swiss Franc – ChartPattern – قناة صاعدة
  • Gold vs US Dollar- KeyLevel – แนวรับ
  • Gold vs Euroymbol – KeyLevel – แนวรับ
  • Gold vs Euro – KeyLevel – مقاومة
  • Gold vs Euro – KeyLevel – مقاومة

Recent Comments

    Translation


     Edit Translation

    Trade with

    a market leader you can rely on

    Open Trading Account Try a Free Demo

    Forex Trading

    • Accounts Overview
    • Open an Account
    • Launch Web Trader

    Trading Specifications

    • Spreads and Commissions
    • Range of Market
    • Trading Hours
    • Funding
    • Withdrawal

    About IC Markets

    • Help Center
    • Why IC Markets
    • Regulation
    • Legal Documents
    • Contact Us


    Forex Trading

    • Accounts Overview
    • Open an Account
    • Launch Web Trader

    Trading Specifications

    • Spreads and Commissions
    • Range of Market
    • Trading Hours
    • Funding
    • Withdrawal

    About IC Markets

    • Chat with a Specialist 24/7
    • Why IC Markets
    • Regulation
    • Legal Documents
    • Contact Us

    Disclaimer: This material is marketing material where all marketing material is published for informational purposes only. This material does not contain and should not be considered as containing - investment advice and recommendations, or suggestions for performing any actions with financial instruments. The built-in widgets belong to their external independent authors, and IC Markets is not responsible for their content and their impact on trade.

    All content rights reserved. Opinions of the authors may not coincide with the opinion of the blog editors. When copying materials from this site or connecting to an RSS feed to republish our articles, a link to IC Markets or attribution in the format ‘IC Markets Blog’ is required. For general questions, please contact the editorial office via the form on the Contact us page.

    Risk Warning: Trading Derivatives carries a high level of risk to your capital and you should only trade with money you can afford to lose. Trading Derivatives may not be suitable for all investors, so please ensure that you fully understand the risks involved and seek independent advice if necessary. A Product Disclosure Statement (PDS) should be considered before entering into a transaction with us.

    The contents of this page are general information only and does not take into account your personal situation, financial objectives or needs. It is up to you to make sure the products that we offer suit your specific needs. You should not trade with us unless you understand the features and risks of the products that we offer. This means that you might need to seek independent advice before you start trading with us.

    © 2022 Raw Trading Ltd | All rights reserved.
    • Sample Page